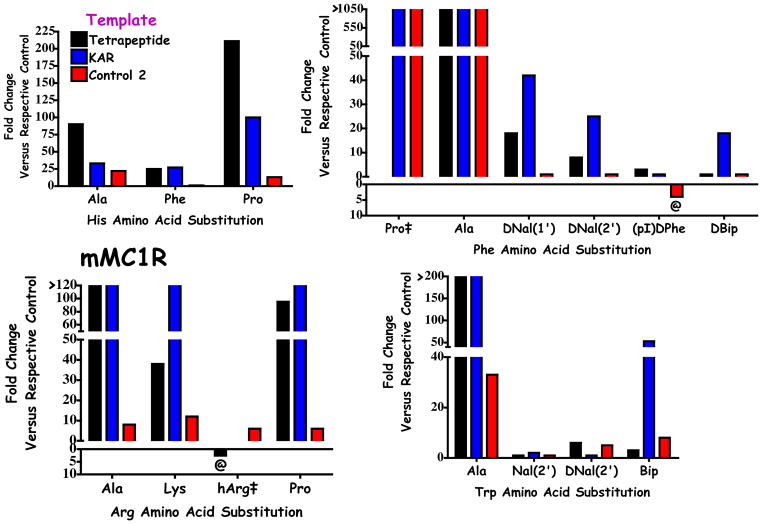
Figure 6.
Histogram comparing the relative fold change in EC50 values of the indicated amino acid relative to the appropriate control ligand at the mMC1R. Color coding- the black bar represents the tetrapeptide template Ac-His-DPhe-Arg-Trp-NH2. The blue bar represents the KAR template Tyr-c[β-Asp-His-DPhe-Arg-Trp-Asn-Ala-Phe-Dpr]-Tyr-NH2. The red bar represents the control ligand 2 in this study. ‡ Signifies that this amino acid substitution was not reported in one of the templates used for the comparative analysis in this study. @ Indicates that the modification results in an increase in potency and is shown as bars pointing down.

