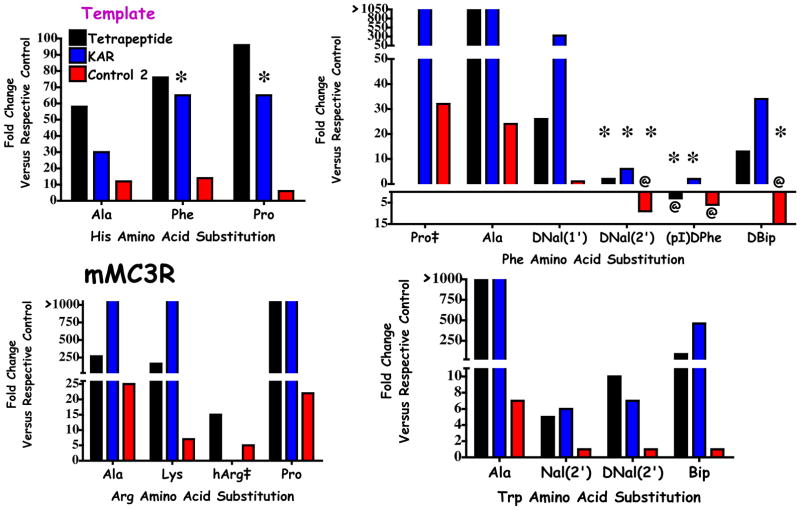
Figure 7.
Histogram comparing the relative fold change in EC50 values of the indicated amino acid relative to the appropriate control ligand at the mMC3R. For the color coding scheme, refer back to the legend in Figure 6. ‡ Signifies that this amino acid substitution was not reported in one of the templates used for the comparative analysis in this study. *Indicates that the amino acid change in the template resulted in an antagonist. @ Indicates that the modification results in an increase in potency and is shown as bars pointing down.

