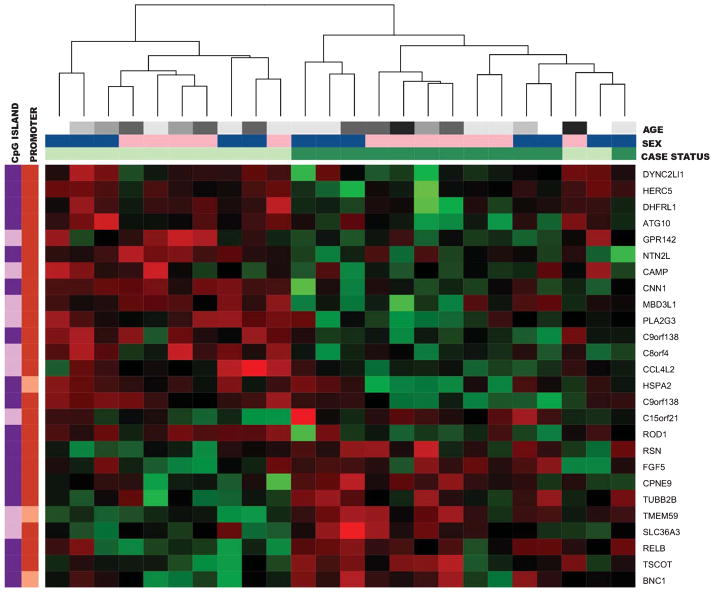
Fig. 2.
Hierarchical clustering heatmap of the Discovery Set top 26 autosomal CpG loci associated with late-onset Alzheimer’s disease (LOAD) case/control status after adjusting for sex and age. Green represents hypermethylation in LOAD cases and red represents hypomethylation in cases. Horizontal color bars at the top refer to the age, sex, and case status of the sample. In the Case Status color bar, light green represents control samples and dark green represents LOAD cases. For sex, female is light pink and male is dark blue. In the age panel, black represents ages 91–95, darkest gray 86–90, medium gray 81–85, light gray 76–80, lightest gray 71–75, and white represents ages 66–70. Vertical color bars on the left refer to the CpG island and promoter status of the CpG sites. In the CpG island bar, dark purple represents sites within CpG islands and light purple represents sites outside of CpG islands. In the promoter bar, dark orange represents sites within promoter regions and light orange represents sites outside of promoter regions.

