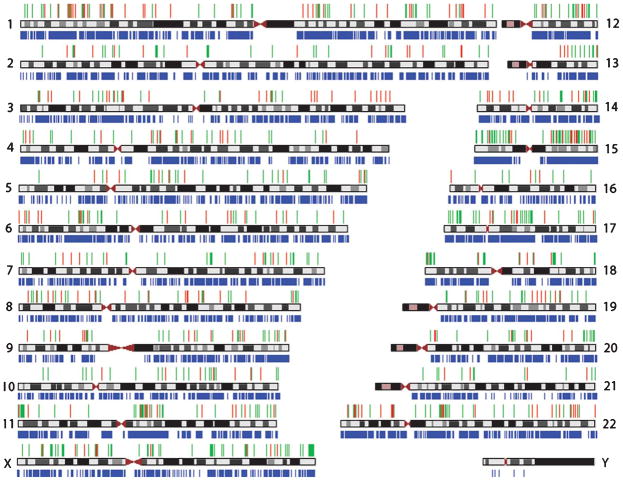
Fig. 4.
Human chromosome ideogram in black. Distribution of CpG sites featured on the Illumina HumanMethylation27 BeadArray is below the chromosomes in blue. Distribution of CpG sites that were significantly associated with late-onset Alzheimer’s disease (LOAD) in the Discovery Set are above the ideograms. Green represents hypermethylation with LOAD status. Red represents hypomethylation with LOAD status.

