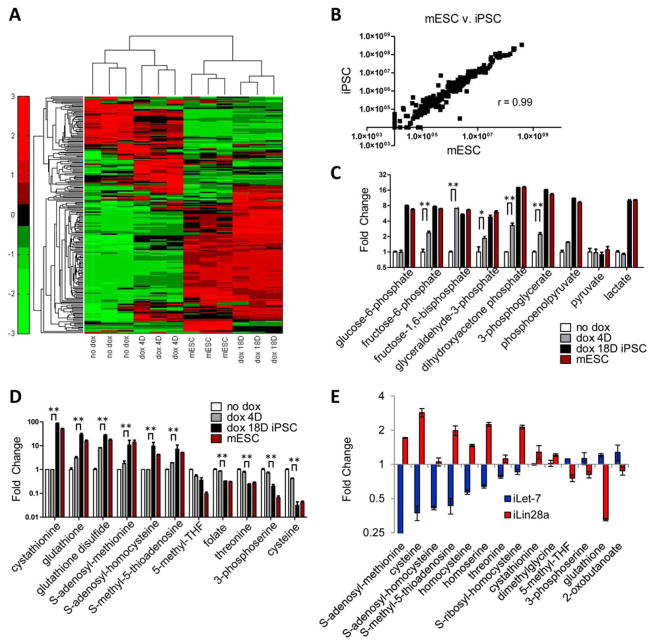
Fig. 1. Thr-SAM pathway is activated by pluripotency factors.
Heat map showing relative abundance of metabolites in iOSKM-MEFs in the absence of doxycycline treatment (no dox), 4 days after dox (dox 4D), 18 days after dox whereupon iPSC clones are fully reprogrammed (dox 18D), and mESCs, normalized to total biomass (n=3), and measured using selected reaction monitoring (SRM) and LC-MS/MS. (B) Scatter plot of metabolite intensities in mESCs (x-axis) vs. iPSCs (y-axis). Metabolite intensities were obtained from the integrated total ion current from a single SRM transition. (C) SRM analysis of abundance in glycolytic intermediates in iOSKM-MEFs during reprogramming (n=3). **P< 0.01, * P< 0.05. (D) SRM analysis of abundance in Thr-SAM pathway intermediates in iOSKM-MEFs during reprogramming (n=3). ** P< 0.01. (E) SRM analysis of abundance in Thr-SAM pathway intermediates in iLet-7 and iLin28a mESCs after dox (n=3). All error bars represent the s.e.m. from three independent measurements.

