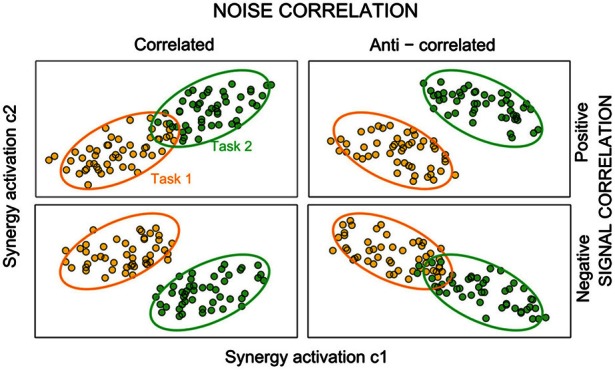
Figure 2.

The effect of interplay of signal and noise correlations between synergies on task information. Each panelsketches joint distributions of activations of two hypothetical synergiesduring two different tasks (data for task one and two are plotted in orange and green color, respectively). The dots represent a hypothetical scatterplot from single-trial activations to the given task, and each ellipse denotes 95% confidence limits. In the upper panel, there is positive signal correlation (i.e., individual synergy activations to each task are positive correlated), whereas in the lower panels there is negative signal correlation. Positive noise correlations correspond to ellipses aligned along the diagonal. The more the ellipses are elongated, the stronger the noise correlation. The sign of noise correlations between the joint responses differs across columns of this figure (noise correlation is positive in the left column and negative in the right column). In this figure, noise correlations are task independent—equally strong across stimuli (all the ellipses within a panel have the same elongation). In general, if noise and signal correlation have opposite signs, the effect of correlations increases the information about tasks, because the joint response probabilities to each task become more separated. If instead noise and signal correlation have the same sign, tasks are less discriminable.
