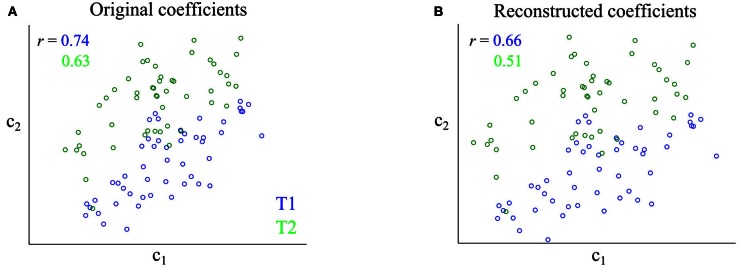
Figure 3.

Impact of synergy extraction using NMF on the correlations between synergy activations. (A) Scatterplot of the original activations of the two simulated synergies for two tasks (T1 and T2). (B) Scatterplot of the activations of the two synergies as identified by the NMF algorithm. The r values report correlation coefficients at fixed task. Noise correlations are slightly weaker after application of NMF to the data.
