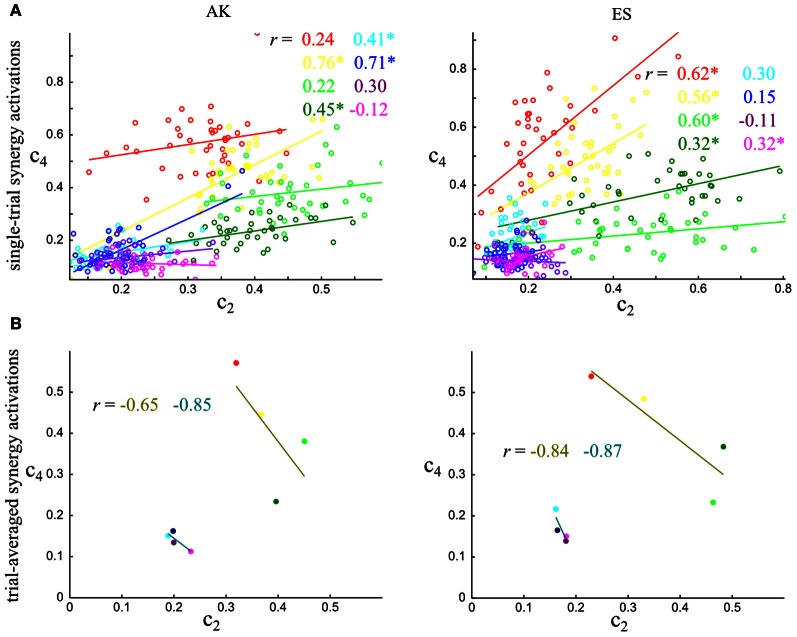
Figure 6.
Quantifying noise and signal correlations between the activations of synergies S2–S4, and assessing their impact on information about the task. (A) Scatterplots of the integral of the single-trial activations of synergies S2–S4 across the eight tasks performed. (B) Scatterplots of the task-averaged activations of synergies S2–S4. The r values report correlation coefficients and the * denotes statistical significance at p < 0.05. Conventions are the same as in Figure 4.

