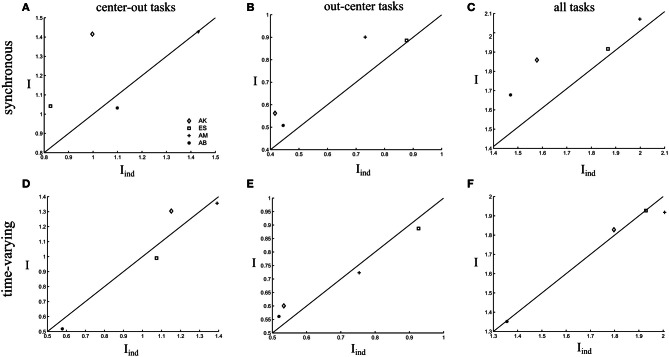
Figure 7.
Comparison of the total information carried by the activations of all synergies when taking into account correlations (I) and when ignoring them (Iind). The scatterplots show the information values in the I-Iind space for all subjects. We plot the 45°-slope line for comparison purposes. (A,D) Comparison of information about the center-out tasks. (B,E) Comparison of information about the out-center tasks. (C,F) Comparison of information about all tasks.

