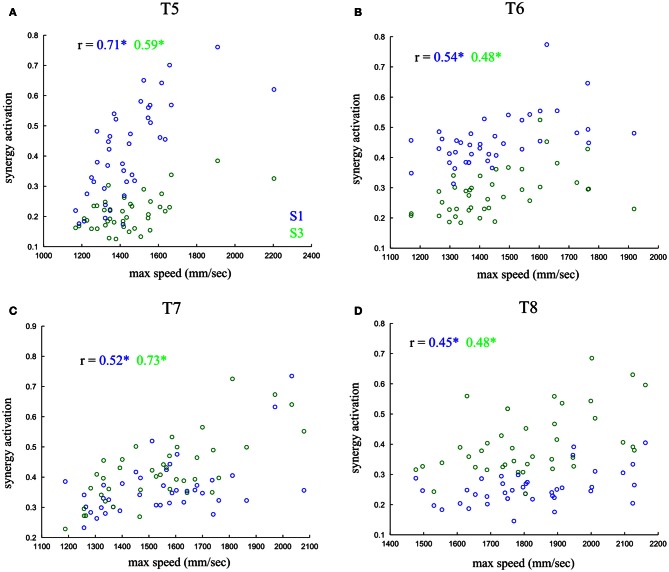
Figure 8.
Dependence of synergy activations on movement speed. Scatterplots of the single-trial activations of synergy S1 (blue) and S3 (green) with respect to the max movement speed in each trial at fixed task. The four panels (A–D) correspond to the four out-center tasks. The r values report correlation coefficients and the * denotes statistical significance at p < 0.05.

