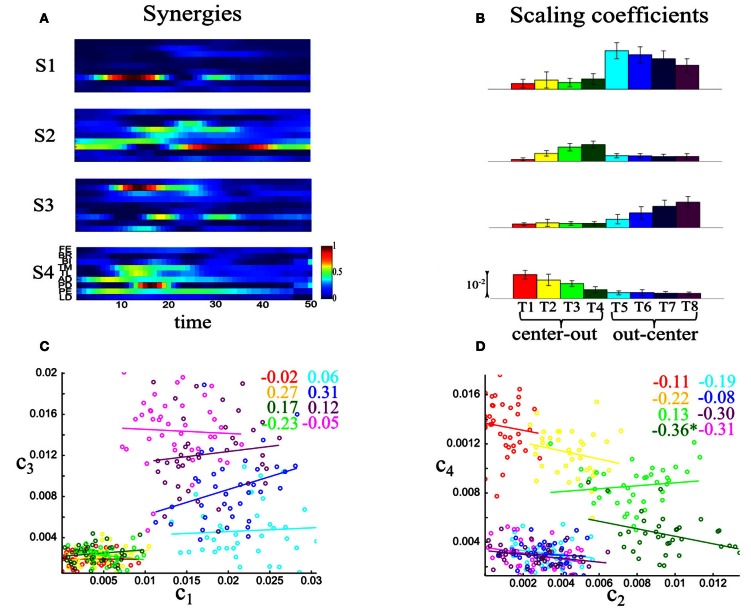
Figure 9.
Quantifying noise correlations between time-varying synergy activations. (A) The four time-varying synergies obtained from the experimental data of one subject (AK) as four matrices each representing the activity of nine shoulder and elbow muscles over 50 time steps. (B) Histograms of the coefficients activating the four synergies across the eight motor tasks performed. Histograms are plotted as means ± SDs across all trials to the given task. (C) Scatterplot of the activation coefficients of synergies S1–S3 across the eight tasks performed. (D) Scatterplot of the activation coefficients of synergies S2–S4 across the eight tasks performed. The reported values are correlation coefficients and the * denotes statistical significance at p < 0.05. Overall, noise correlations are much weaker than for the synchronous synergy activations.

