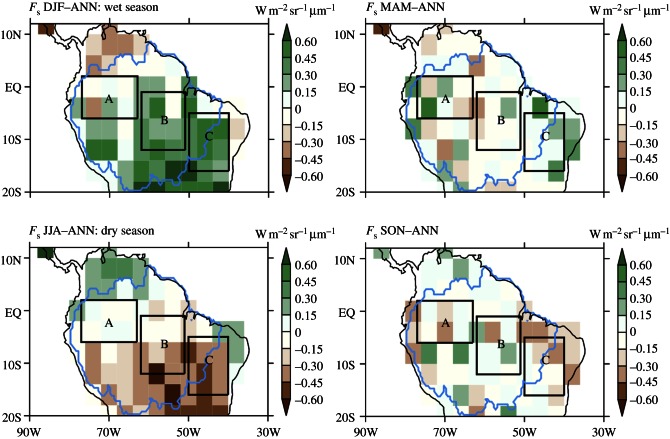
Figure 1.
Seasonal variation of chlorophyll fluorescence, Fs (W m–2 sr–1 μm–1), retrieved from GOSAT in 755 nm over Amazonia during June 2009–May 2010. The annual mean is subtracted from the seasonal mean to show fluorescence seasonality. Boxes A, B and C are relative everwet, wet and dry areas, respectively, for the analysis in figures 2 and 3. The outline in the map line represents the Amazon basin. The resolution in the figure is coarse because GOSAT provides only one measurement at every 4 s and the retrieval exhibits a high single measurement noise. (Online version in colour.)

