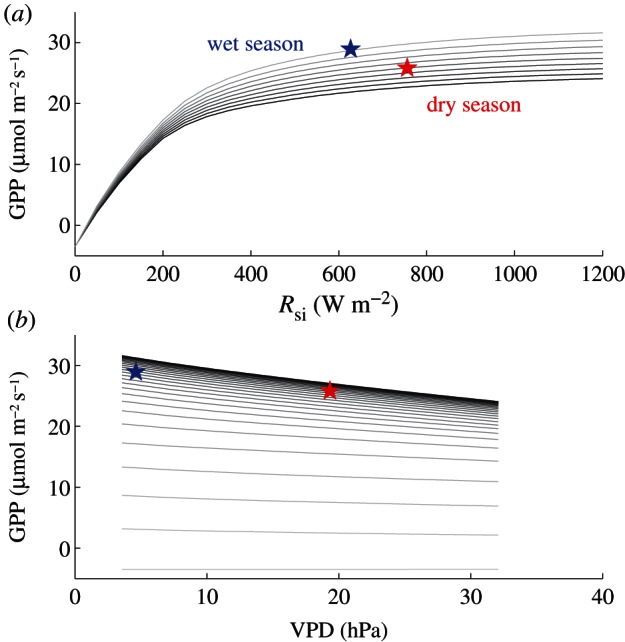
Figure 5.

SCOPE-simulated relationships (a) between incoming radiation (Rsi) and GPP and (b) between VPD and GPP. Different lines in (a) represent GPP values at different VPD ranging from 3.5 to 32 hPa in nearly equal steps (actual values are for relative humidity from 10 to 90%; high VPD values give low GPP values), and different lines in (b) represent GPP values at different solar energy from 50 to 1200 W m−2 in 50 W m−2 range (low solar radiation values give low GPP values). Midday incident radiation over Amazonia ranges between 400 and 800 W m−2 and VPD range from 3 to 40 hPa (see the electronic supplementary material, figure S3). The symbols indicate the mean midday ECMWF ERA values of VPD and irradiance during the dry (June-July-August) and wet (December-January-February) seasons of 2009 and 2010. (Online version in colour.)
