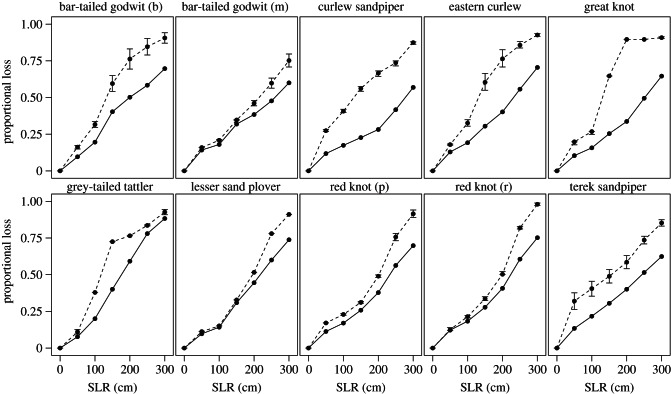
Figure 2.
Proportional losses in habitat extent and population flow in migratory shorebirds. Loss of habitat extent (solid line) and loss of population flow (broken line) both rise with increasing sea level, although the latter always equals or exceeds the former. Taxa vary in the degree to which the impact of habitat loss is magnified by migratory connectivity (the area between the two curves). The sensitivity to uncertainty surrounding the connectivity is estimated by randomly changing the weights of edges by ±30%. Error bars indicate the highest and lowest range of losses in population flow calculated from 1000 iterations. For bar-tailed godwit, (b) indicates subspecies baueri and (m) subspecies menzbieri. For red knot, (p) indicates subspecies piersmai and (r) subspecies rogersi.

