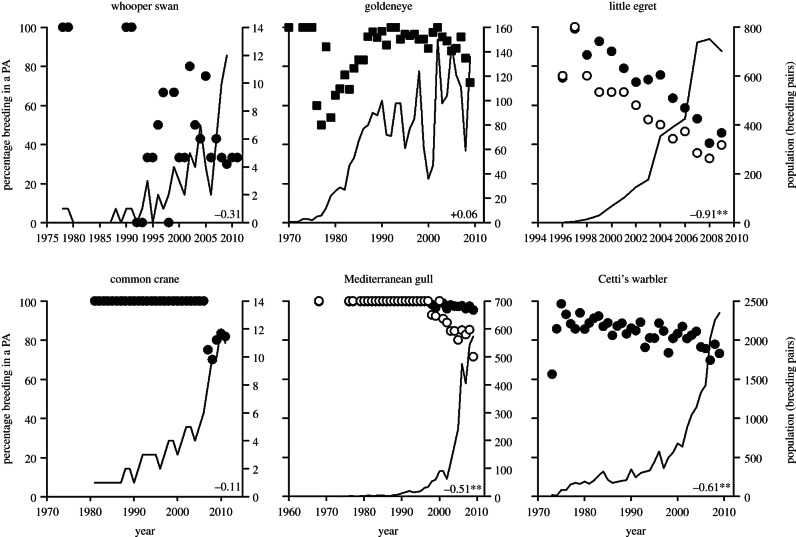
Figure 1.
The percentage of breeding pairs (or singing males for Cetti's warbler) of each colonizing species in PAs each year since colonization (closed circles). For colonial species, the percentage of breeding localities (open circles) within PAs each year is also shown. The squares for goldeneye denote that some data are known to be missing. Lines represent population estimates based on RBBP reports (see the electronic supplementary material). Spearman's rank values (lower right of each panel) describe correlations between year-since-arrival and percentage breeding in PAs (*p < 0.05 and **p < 0.01).

