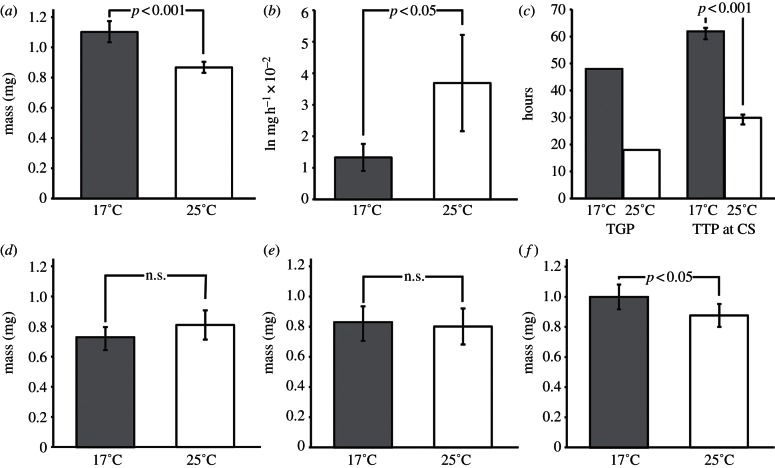
Figure 2.
Effect of temperature on key size-regulating developmental parameters. Black bars depict values for 25°C, grey bars depict 17°C. (a) Critical size calculated using the breakpoint method. (b) Logarithmic growth rate during TGP. (c) Duration of TGP and TTPCS. (d) Mass gained during TGP. (e) Mass loss during pupariation and metamorphosis. (f) Wet weight at eclosion. All error bars are 95% CIs. See text for details of statistical comparisons.

