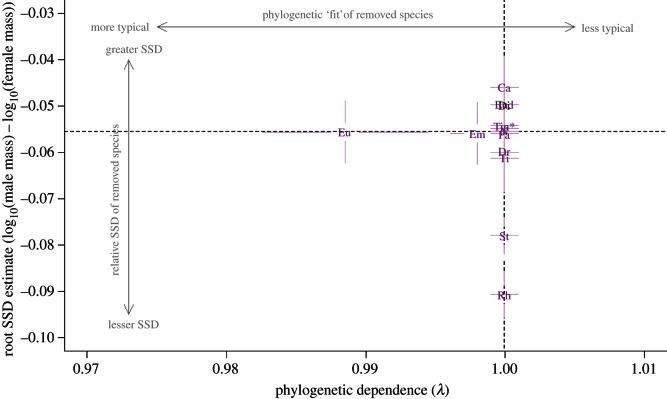
Figure 5.
Estimates of λ plotted against root estimate of SSD averaged across all six phylogenetic hypotheses, showing how excluding each genus from analyses changes the estimates. Dashed lines intersect at the values of λ and estimated root body size when all genera are included in analyses. Lines radiating from plotted genera are standard error bars. Genera exhibiting strongly female-biased SSD appear above the black dashed line, whereas those with less female-biased or male-biased SSD appear below the line. Abbreviations as for figure 1. (Online version in colour.)

