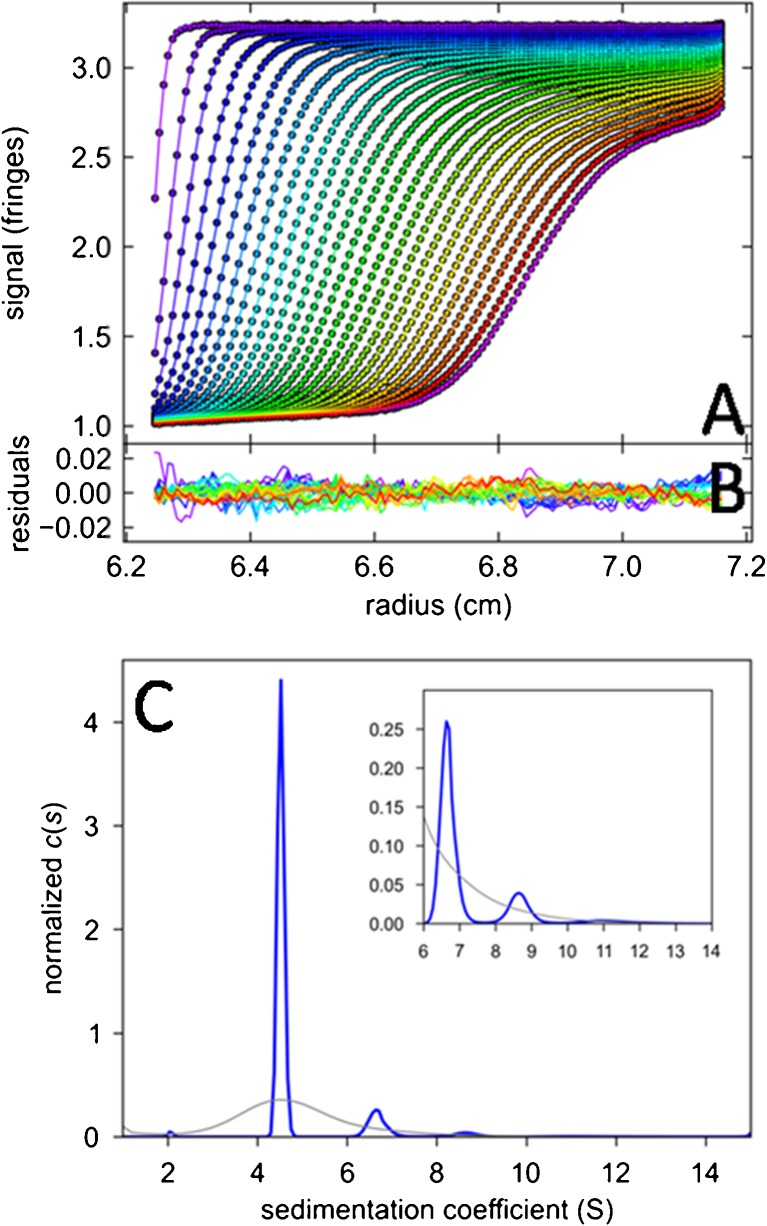
Fig. 2.
Sedimentation velocity data of a sample of bovine serum albumin and c(s) analysis. a Interference optical fringe profiles (every 5th scan and every 10th data point shown) at different point in time as indicated by color temperature. Solid lines are the best-fit model from c(s) analysis with maximum entropy regularization on a confidence level of P = 0.95, producing residuals as shown in b. c The corresponding c(s) distribution (blue) and, for comparison, the best-fit distribution ls-g*(s) (Schuck and Rossmanith 2000) without diffusional deconvolution (gray)

