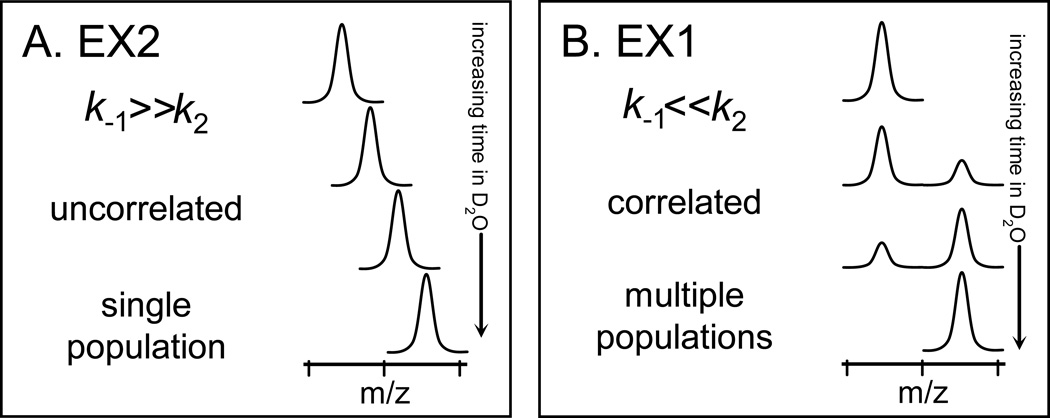
Figure 1.
The distinctive appearance of EX2 and EX1 kinetics in hydrogen exchange mass spectrometry. With increasing amounts of time in D2O, the extremes of the (A) EX2 and (B) EX1 kinetic limits are distinguishable for both proteins and peptides. In EX2, due to random protein fluctuations, the rate of refolding (k−1) (see Equation 1) is much larger than the rate of labeling (k2) and the exchange is classified as uncorrelated. Such exchange produces a single population of molecules that gradually gain mass during the timecourse of the labeling experiment. In EX1, k2 is much larger than k−1 and regions of the protein can all become labeled before refolding (k−1) occurs. This type of exchange is termed correlated as all residues in a region undergoing EX1 appear to have exchanged at the same time. In the mass spectra of EX1, there are two peaks: one for the population that did not yet unfold and become deuterated (at lower m/z) and one for the population that did unfold and become deuterated (at higher m/z). This Figure was taken from [32].

