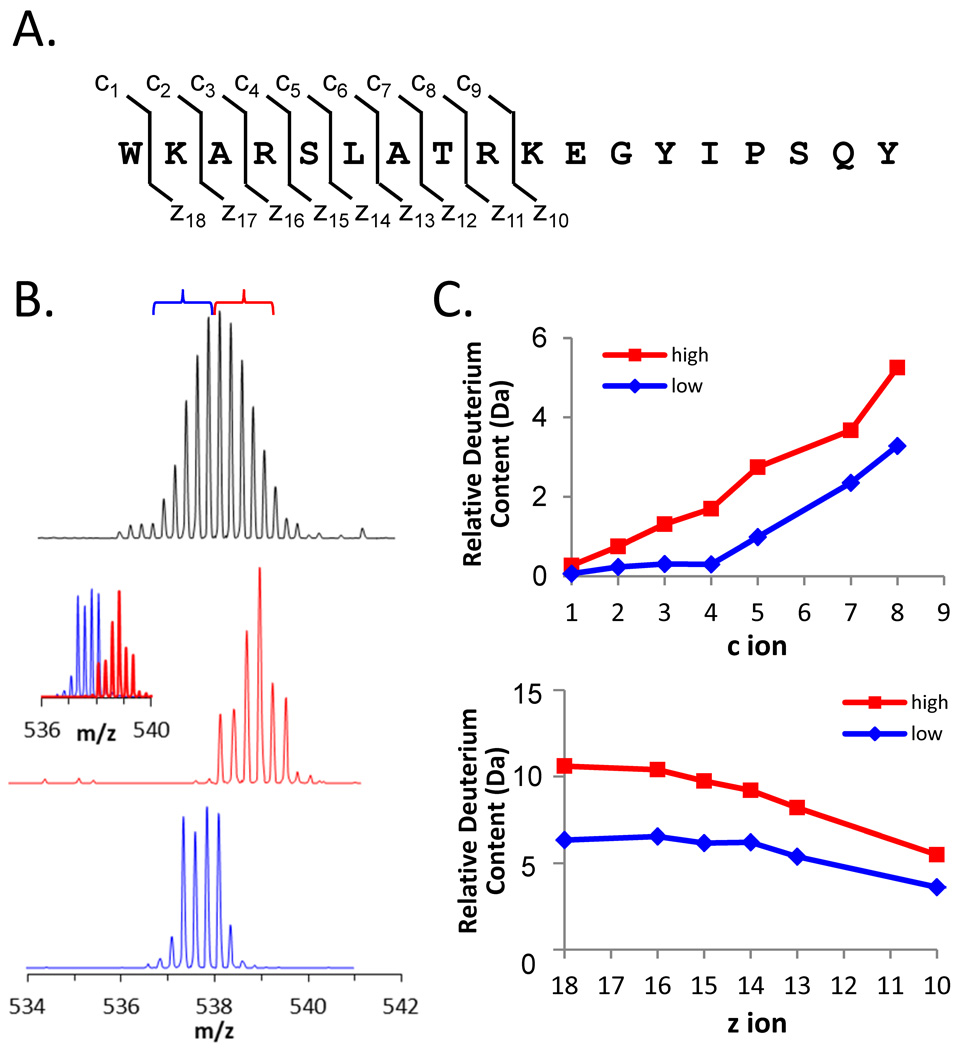
Figure 11.
ETD analysis of deuteration in the peptide 115–132 of Hck SH3. (A) The sequence of residues 115–132 with the c and z ion cleavage positions indicated. These c and z product ions were the only ones for which reliable data could be obtained; fragmentation of the C-terminal part of the peptide was not efficient. (B) Mass spectra of the +4 charge state of peptide 115–132 after 15 minutes of deuterium exchange (top). The low-mass region (blue bracket) and the high-mass region (red bracket) of the entire peak were independently selected for ETD using a quadrupole LM resolution setting of 15. The isolated ions are shown in the middle (red) and lower (blue) spectra; the combination of the red and blue spectra is shown in the inset. All spectra were obtained with a Waters Synapt G2 equipped with ETD using mild conditions that minimize deuterium scrambling [113]. (C) Deuterium content of the high- and low-mass selections according to the product ions of the c-type (top) and z-type (bottom).

