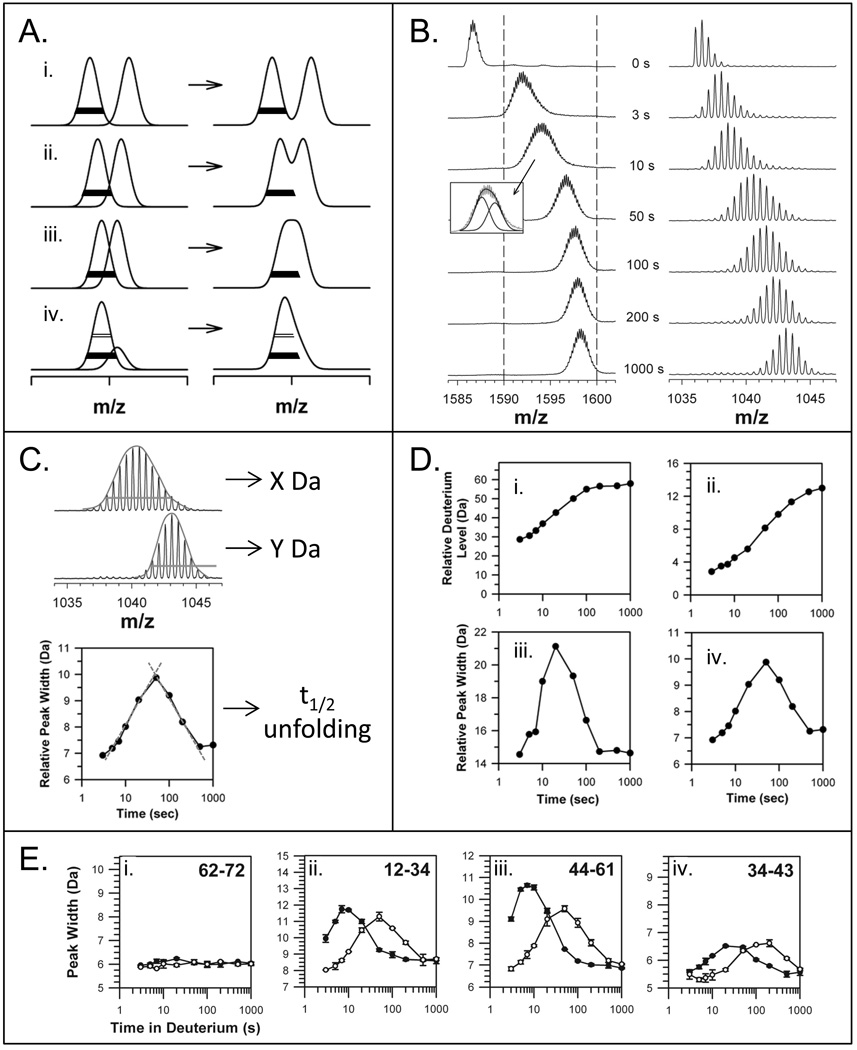
Figure 6.
Mass spectral peak width as it relates to EX1 kinetics. (A) The various ways in which EX1 can be seen in mass spectra, from well resolved peaks to peak shoulders [32]. The two deconvoluted and resolved peaks are shown on the left and the merged peaks, as observed in raw spectra, are shown on the right. The bars (open at 50% peak intensity and solid at 20% peak intensity) are the same width in all panels. (B) Unresolved EX1 signatures are apparent in the spectra for intact Lck SH3 (left panel) and the Lck SH3 peptide representing residues 44–61 (right panel) [72]. The dotted lines in the left panel are to guide the eye. The inset indicates how two Gaussian distributions fit under the raw data for the intact protein spectra after 10 seconds in deuterium. These mass spectra were acquired with instrument resolution of ~10,000, which higher than older data (Figure 2A) acquired with instrument resolution of ~2,500. (C) The peak width can be used to determine unfolding half-life. The entire width of the isotope distribution is measured, usually at 50% or 20% peak height. In this example, the width at 50% peak intensity is shown by the orange line. The orange line is the same width for both spectra to illustrate how the lower spectrum (Y Da wide) is much more narrow than the upper spectrum (X Da wide). These spectra are taken from part B (top=50 sec, bottom=1000 sec). The peak width (this time at 20% peak intensity) versus time is plotted as shown (bottom graph) and the apex, which represents the t1/2 of unfolding, is determined from the intersection of tangents to the peak on the log scale (red lines) (see [73,105] for details). (D) Deuterium incorporation (i, ii) and peak width-plots (iii, iv) for the unresolved EX1 data on Lck SH3 in part B. These data were taken from Ref. [72]. (E) Examples of using peak width to detect protein:ligand interactions. In this example, the Lck SH3 domain alone (solid symbols) and Lck SH3 bound to a high-affinity peptide from the HVS Tip protein (open symbols) were compared. The residues of each peptide are indicated in the top right of each graph. Lck SH3 domain binding slows unfolding as indicated by the shifts of the peak-width plots to the right upon binding. These data were taken from Ref. [72].

