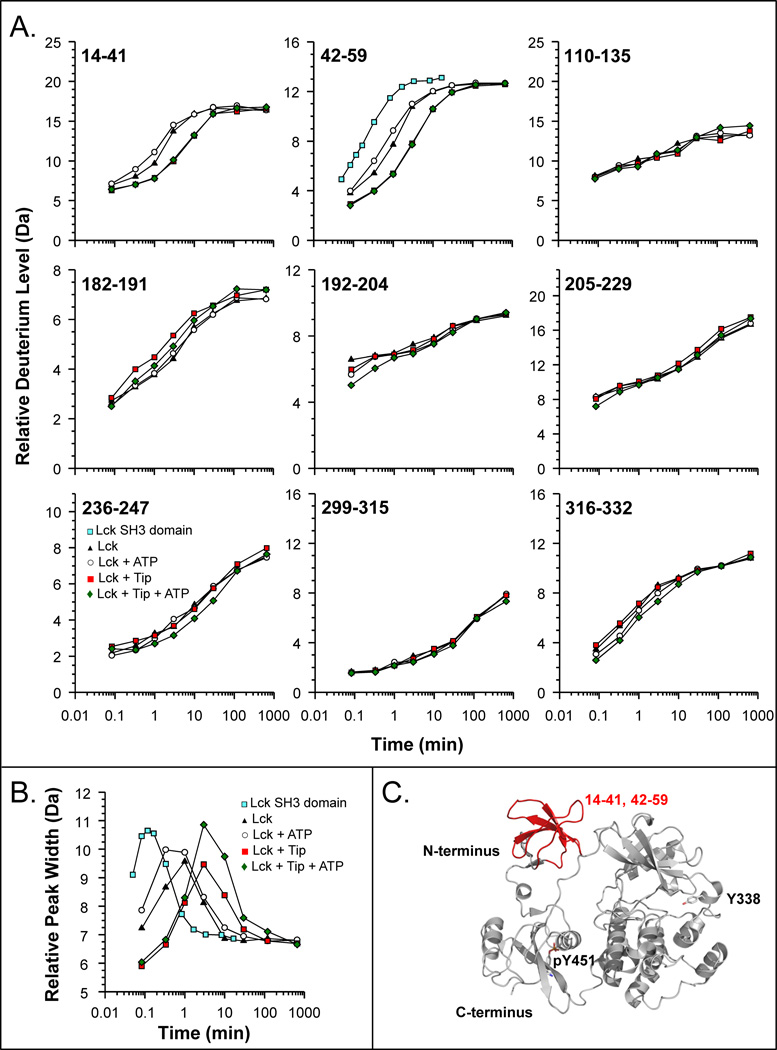
Figure 7.
HX MS of the Lck protein. (A) Deuterium uptake curves for selected peptic peptides of Lck (solid triangles), Lck + ATP (open circles), Lck + Tip (solid red squares), and Lck + Tip + ATP (green diamonds). Also shown for peptide 42–59 is the deuterium uptake curve for the free SH3 domain of Lck (blue squares) [72]. The residues of each peptide are indicated in the upper left corner of each plot. The maximum of the vertical axis in each graph is the maximum number of exchangeable amide hydrogens. In all these experiments, LckYEEI [56,75] was used. (B) Peak width plot for Lck peptide 42–59, measured at 20% of peak maximum. (C) Regions of the Lck SH3 domain that experienced alterations in deuterium incorporation in response to Tip and/or ATP binding. The structure shown is a homology model for Lck based on the structure of down-regulated Hck (PDB 1QCF, [60]).

