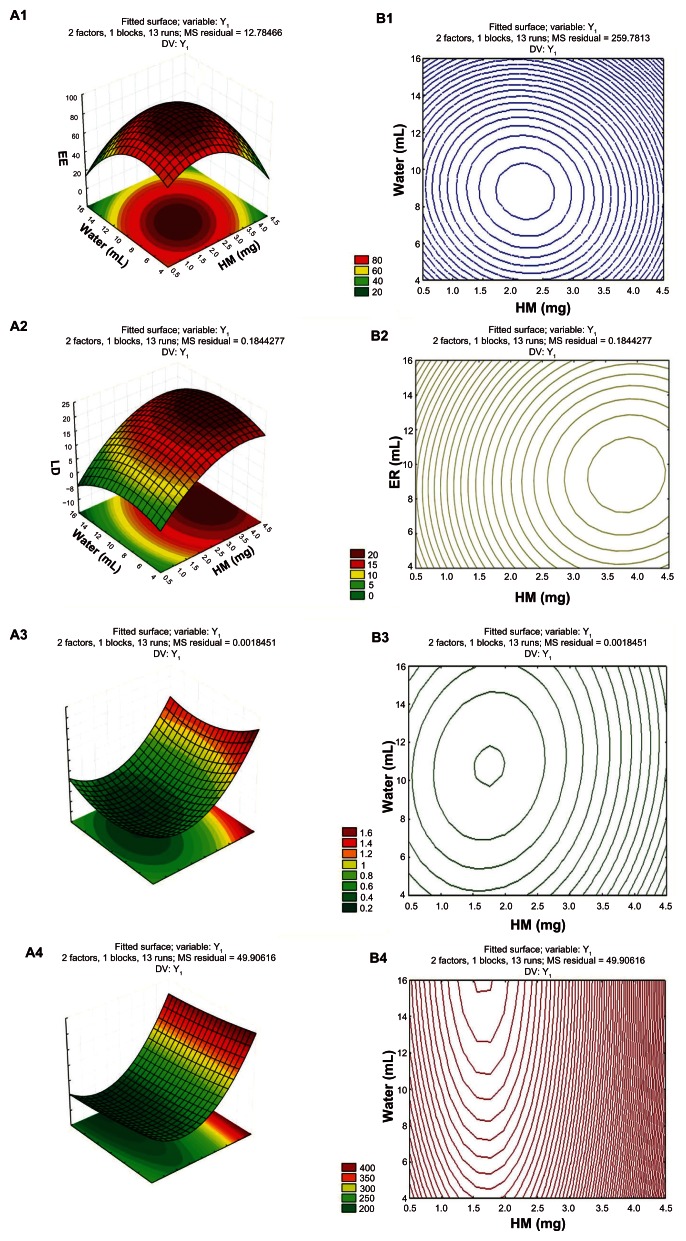
Figure 6.
Three-dimensional response surface (A1–A4).
Notes: Contour plot (B1–B4) shows the impact of HM amount (X1), and hydration volume (X2) on EE (Y1), LD (Y2), PDI (Y3), and particle size (Y4), respectively.
Abbreviations: EE, encapsulation efficiency; LD, drug-loading amount; PDI, particle size; HM, harmine.

