
Figure 1.
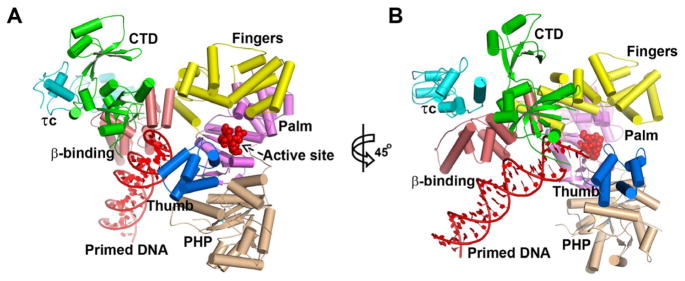
Cartoon views of the PolIIIα-τc-DNA complex. The PHP, palm, thumb, fingers, β-binding, and CTD of PolIIIα, the primed DNA, and τc are labeled with wheat, violet, marine, yellow, salmon, green, red, and cyan colors respectively. The active site metal binding residues (D463, D465 and D618) in the palm domain are shown using red spheres. The right figure (B) is achieved by rotating the left one (A) by 45° along the y axis of the figure plane. See also Figures S1–S3.