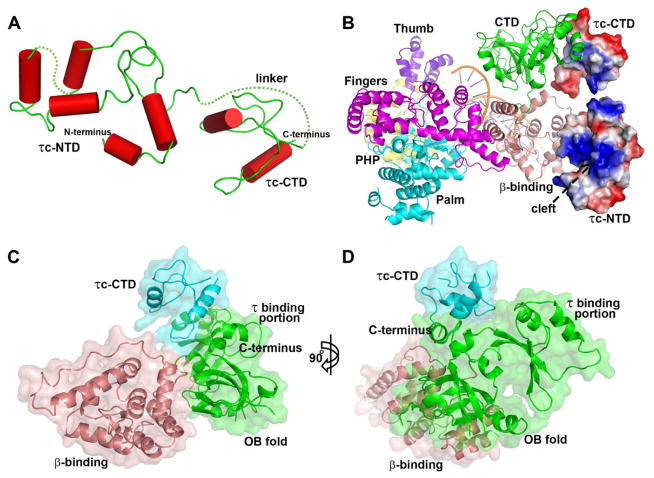
Figure 2.
τc structure and the interactions of the CTD of τc and the CTD of PolIIIα. (A) The structure of τc is composed of two domains that contain only α-helices and are linked by a proline-rich linker. The dotted lines represent the disordered regions. (B) The primed DNA and the six domains of PolIIIα are shown in a schematic representation with different colors, whereas τc is shown in an electrostatic surface representation using PyMOL. The positively charged cleft that may bind ssDNA on the NTD of τc is labeled. (C and D) Surface representation shows the interaction regions of τc CTD and PolIIIα and their relative positions. The NTD of τc is omitted here. The right figure (D) is obtained by rotating the left one (C) by 90° along the y axis of the figure plane. See also Figure S4.

