
Figure 2. Pattern of NFKBIA Deletion and EGFR Amplification in Glioblastomas.
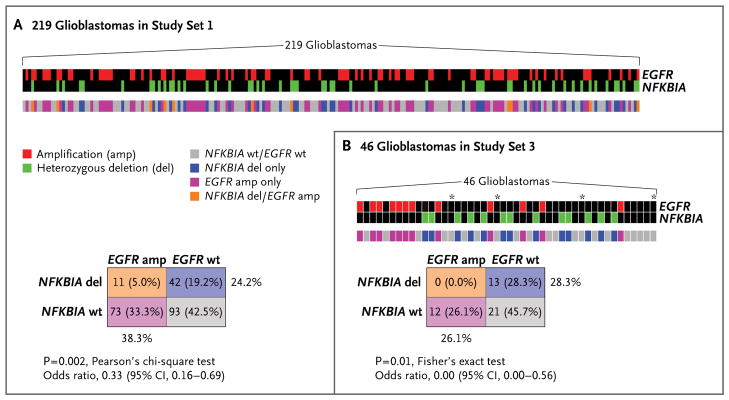
Panel A shows gene-dosage profiles for NFKBIA and EGFR across 219 glioblastomas in study set 1 and their relationship to each other; the color key indicates the status of both genes in individual tumors. A corresponding two-way contingency table shows that NFKBIA deletion and EGFR amplification occur mutually exclusively in glioblastomas. Panel B shows the relationship between NFKBIA deletion and EGFR amplification in 46 glioblastomas in study set 3 and a corresponding two-way contingency table. Asterisks indicate samples in which there was potential contamination by nontumor tissue.