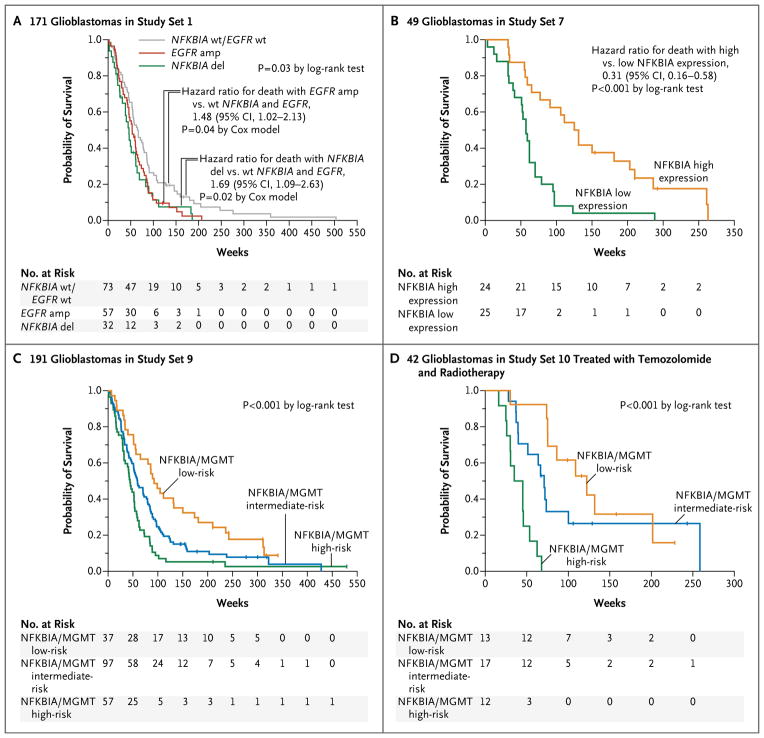
Figure 4. NFKBIA and Survivalin Patients with Glioblastomas.
Kaplan–Meier estimates of overall survival are shown for 171 patients in study set 1 with newly diagnosed glioblastomas (Panel A), with patients stratified into three subgroups according to the presence of tumors with NFKBIA and EGFR wild-type (wt) status, NFKBIA deletion (del) without EGFR amplification (amp), or EGFR amplification without NFKBIA deletion (9 patients with tumors that had alteration of both NFKBIA and EGFR were omitted owing to the small sample size). Kaplan–Meier estimates of survival are shown for the 49 patients in study set 7 (Panel B), with patients stratified according to median NFKBIA expression. The combined NFKBIA and O6-methylguanine DNA methyltransferase (MGMT) risk-group models are shown for 191 patients with glioblastomas in study set 9 (Panel C) and for 42 patients with newly diagnosed glioblastomas in study set 10 who were treated with radiotherapy plus concomitant and adjuvant temozolomide (Panel D). Assignment of patients to low-, intermediate-, or high-risk groups was based on NFKBIA expression (dichotomized at the median) and MGMT status (MGMT expression dichotomized at the 60th percentile or based on MGMT promoter methylation status). In Panel C, NFKBIA expression higher than the median combined with MGMT expression lower than the 40th percentile denotes a low-risk group, and NFKBIA expression lower than the median combined with MGMT expression higher than the 60th percentile denotes a high-risk group. In Panel D, NFKBIA expression higher than the median combined with methylated MGMT promoter status denotes a low-risk group, and NFKBIA expression lower than the median combined with unmethylated MGMT promoter status denotes a high-risk group; all other cases were assigned to an intermediate-risk group. Small vertical lines indicate patients who were alive at the last follow-up assessment. P values were calculated with the use of the log-rank test.

