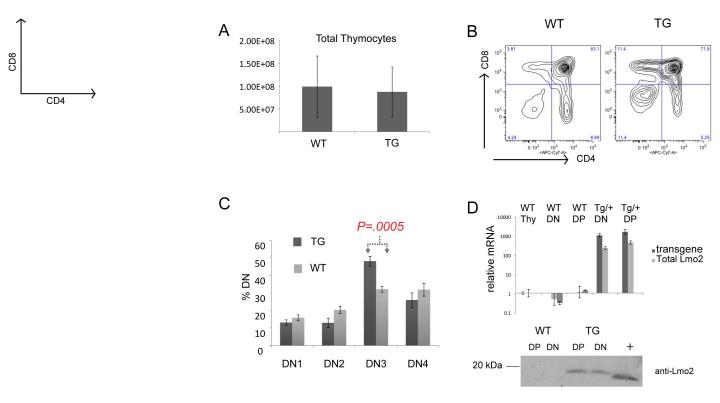
Figure 1. Lmo2 transgenic mice show increased T-cell progenitors at DN3 stage.
(A) bar graph shows counts from WT (n=8) and CD2-Lmo2 transgenic (TG, n=6) thymocytes with S.D. shown with error bars. (B) shows representative contour plots of WT and TG thymi stained for CD4 and CD8. (C) WT (n=8) and TG (n=9) thymocyte double negative thymocytes were subtyped for DN1-4 by CD44 and CD25 staining; percentage of each is shown. P value is from two-tailed Student t-test. (D) graph shows qRT-PCR for Lmo2, total and transgenic. Bottom panel shows a western blot of whole protein lysate from TG or WT DN or DP thymocytes probed with anti-Lmo2 antibody; “+” denotes 293T lysate transfected with an Lmo2 expression plasmid. Error bars show the SD.

