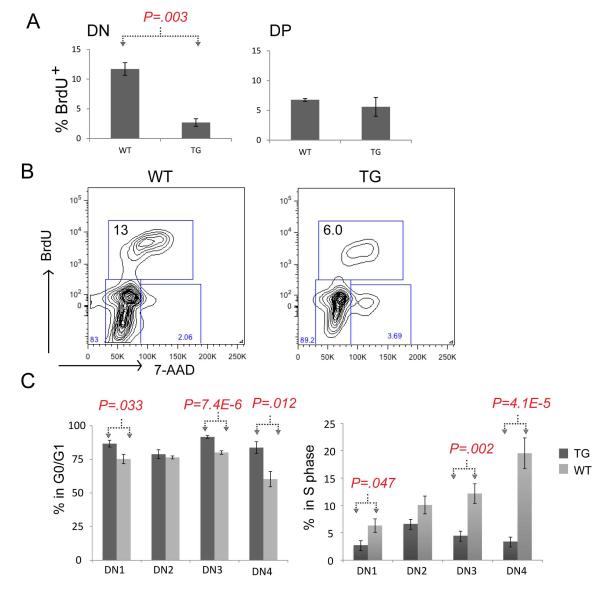
Figure 2. Lmo2 transgenic T-cell progenitors have decreased BrdU uptake.
(A) Bar graphs show the percentage of cells staining with anti-BrdU antibody after in vivo labeling of WT (n=4) and TG (n=5) mice. P value is a result of Student t-test; DN, double negative; DP, double positive thymocytes were electronically gated. (B) shows representative FACS contour plot of in vivo BrdU labeling of DN (electronically gated) thymocytes from WT and TG mice; y-axis is anti-BrdU and x-axis shows 7-AAD staining. Box shows the proportion of cells in S phase in these WT and TG mice. (C) Bar graph shows the mean percentage of DN1-4 subsets in G0/G1 (left panel) or in S-phase. Dark gray denotes TG (n=9) T-cell progenitors and light gray denotes WT (n=8); error bars show the SD. Brackets and P values show two-tailed Student t-test analysis.

