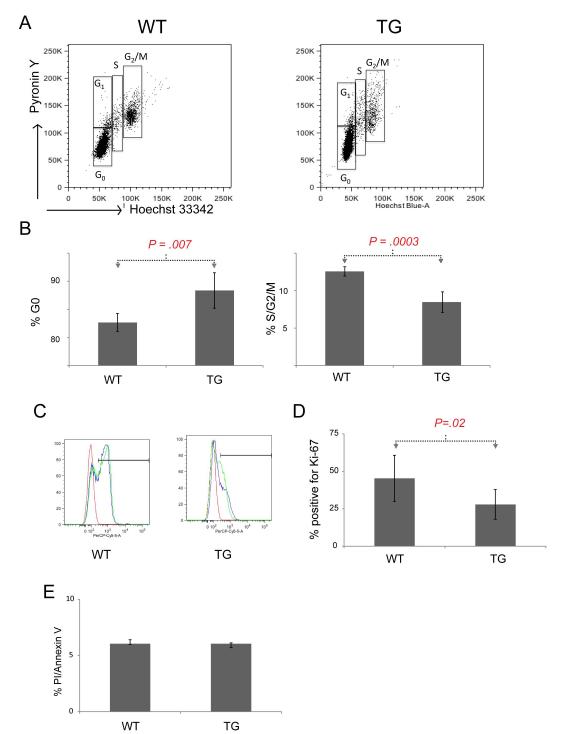
Figure 3. Lmo2 transgenic T-cell progenitors are quiescent.
(A) representative FACS plots for DN thymocytes isolated from TG or WT mice stained for pyronin Y (y-axis) or Hoechst are shown. Boxes denote cell cycle phases. (B) Bar graph shows the mean of cell cycle phases for TG (n=5) and WT (n=5) DN thymocytes in G0 (left panel) or in combined S/G2/M phases (right panel). Error bars show the SD. Brackets and P values are from two tailed Student t-test analysis. (C) A representative FACS plot shows the staining of TG and WT DN thymocytes with anti-Ki67 antibody. The bar shows positive staining. Red curve is isotype control; blue and green are specific antibody. (D) Bar graph shows the mean percentage of DN thymocytes staining positive for Ki-67 antigen in TG (n=10) and WT (n=6) mice. (E) Bar graph shows the mean proportion of positive cells in TG and WT. Error bars show the SD. Bracket and P value are from two-tailed Student t-test analysis.

