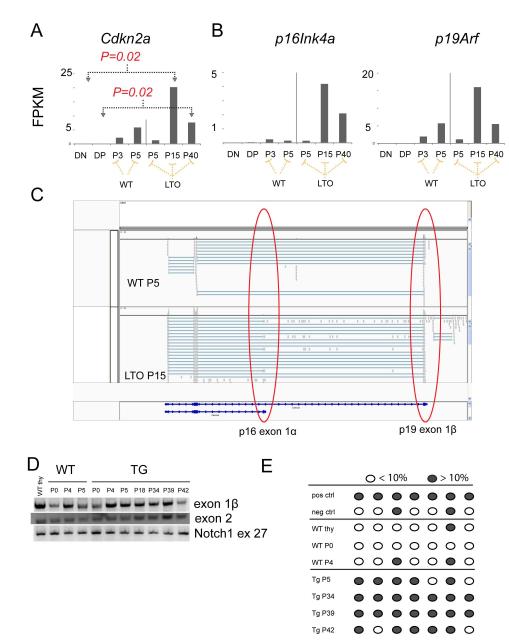
Figure 5. Lmo2 expressing T-cell progenitors deregulate Cdkn2a expression concordant with immortalization.
(A) Bar graphs show the normalized quantification of total Cdkn2a transcripts in FPKM (fragments per kilobase per million reads) for DN and DP thymocytes from WT mice; passage 3 and 5 of WT T cells in OP9-DL1 culture; and, passages 5, 15, and 40 of TG T-cell progenitors. P values are from comparisons of bracketed values and are corrected for multiple hypothesis testing. FPKMs for p16Ink4a and p19Arf are shown for the same samples. P values were not statistically significant and are not shown. (C) This schematic is a snapshot of the Integrated Genome Viewer (IGV) that shows WT P5 and TG (LTO) P15 RNA-seq reads. The red circles show the exon 1β of p19 and exon 1α of p16. The latter was only found in the LTO samples. (D) Agarose gel shows PCR of gDNA for exon 1β, exon 2 of Cdkn2a and of exon 27 of Notch1. Numbers denote passage number for WT and TG cells. (E) Schematic shows analysis of CpGs in the promoter of p16 analyzed by PCR of bisulfite-converted gDNA from WT or TG T cells from various passages. Dark gray circles show greater than 10% methylation whereas open circles show less than 10% methylation as analyzed by pyrosequencing.

