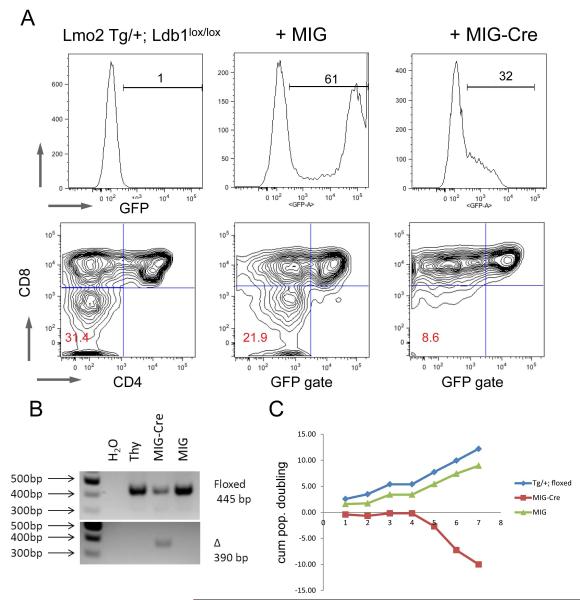
Figure 7. Lmo2 requires Ldb1 to induce and maintain DN progenitors.
(A) DN thymocytes were sorted from TG/+; Ldb1lox/lox mice and transduced with MIG or MIG-Cre retroviruses and plated on OP9-DL1 and passaged weekly; FACS plots in the top panel show the proportion of cells positive for GFP emission in the three groups. Bottom panel shows FACS contour plots of CD4 and CD8 staining. Red numbers show the proportion of cells in the DN quadrant. (B) Agarose gel of gDNA PCR from the same experiment shown in (A) shows floxed and deleted amplicons. (C) shows a line graph of cumulative population doublings (y-axis) of GFP+ cells in culture versus passage number (x-axis). Blue shows untransduced TG thymocytes; green line shows MIG transduced; and, red line shows MIG-Cre transduced cells. The FACS plots are representative of three independent transductions.

