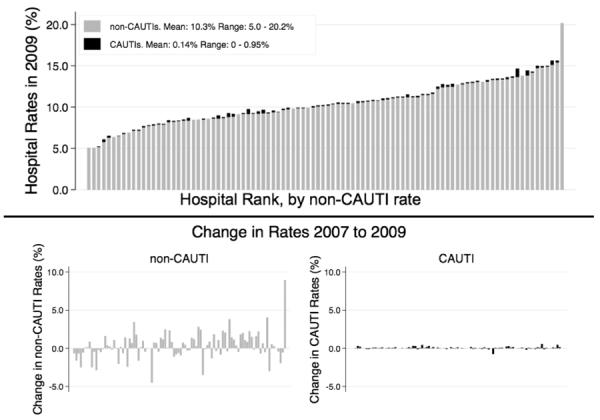
Figure 2. Michigan hospital ratesa In 2009 (top) and change In rates from 2007 to 2009 (bottom).

non-CAUTI: Non-catheter-associated Urinary Tract Infection; CAUTI: Cathater-associated Urinary Trad Infection.
aHospital's rate of diagnosis calculated as the percentage of each hospital's adult discharges with the indicated diagnosis.
