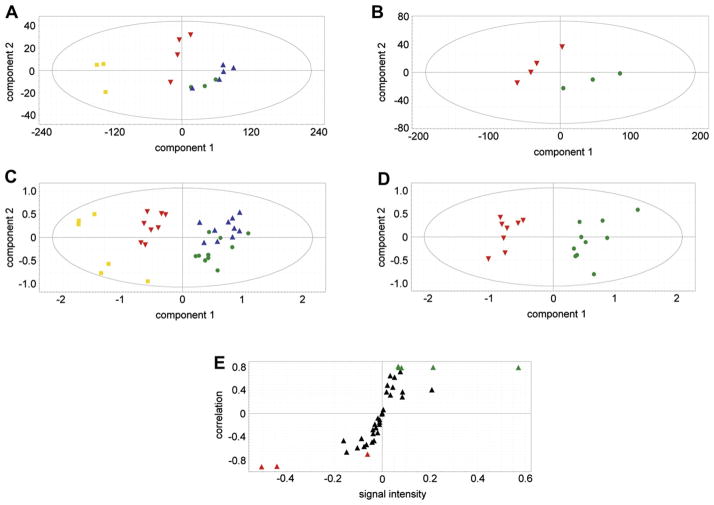
Fig. 4.
(A,B) Pilot study. (A) PCA scores plot for three sham-operated negative control animals (
 ) and four intestinal ischemia animals at 2 h (
 ) and at 4 h (
 ) together with three peritoneal sepsis–positive control animals (
 ). Note that the sham controls and 2-h ischemia animals clustered together, but that the 4-h ischemia and peritoneal sepsis animals clustered separately from the other two groups. (B) PCA scores plot for sham versus 4-h ischemia. Symbol key as above. (C,D) Principal study. (C) PCA scores plot for 10 sham-operated negative control animals and 10 intestinal ischemia animals at 2 h and at 4 h together with 8 peritoneal sepsis–positive control animals. Note that, as in the pilot study, the sham controls and 2-h ischemia animals clustered together, but that the 4-h ischemia and peritoneal sepsis animals clustered separately from the other two groups. (D) PCA scores plot for sham versus 4-h ischemia. Symbol key as above. (E) OPLS-DA loadings S-plot showing five markers highly significantly associated with sham-operated animals (
 ) (downregulated in ischemia) and three markers highly significantly associated with 4-h intestinal ischemia (
 ) (upregulated in ischemia). Markers were chosen on the basis of a correlation value > 0.7 or < −0.7. (Color version of figure is available online.)

