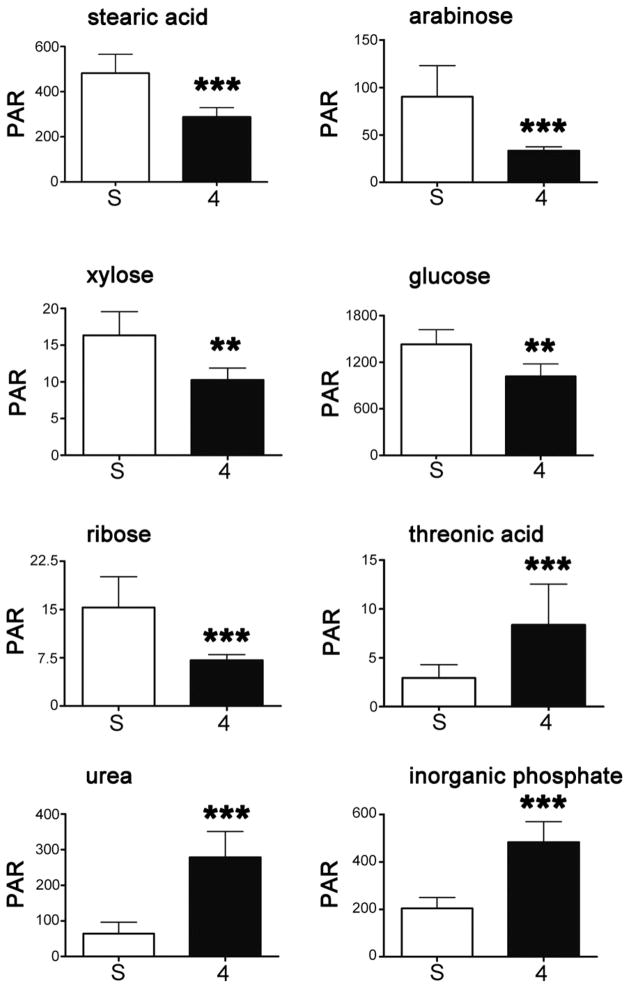
Fig. 5.
The top eight metabolites responsible for the separation between sham-operated sera and intestinal ischemia 4-h sera. Downregulated metabolites were stearic acid, arabinose, xylose, glucose, and ribose. Upregulated metabolites were threonic acid, urea, and inorganic phosphate. Ordinate values are peak area ratios (PAR), i.e., relative concentrations (area of peak/area of internal standard peak × 1000) of each metabolite. Bars represent mean ± standard deviation. S denotes sham; 4 denotes intestinal ischemia 4-hour sample. *** denotes P < 0.001 and ** denotes P = 0.002, by 2-tailed Mann-Whitney U test with Bonferroni correction for multiple comparisons (n = 8).

