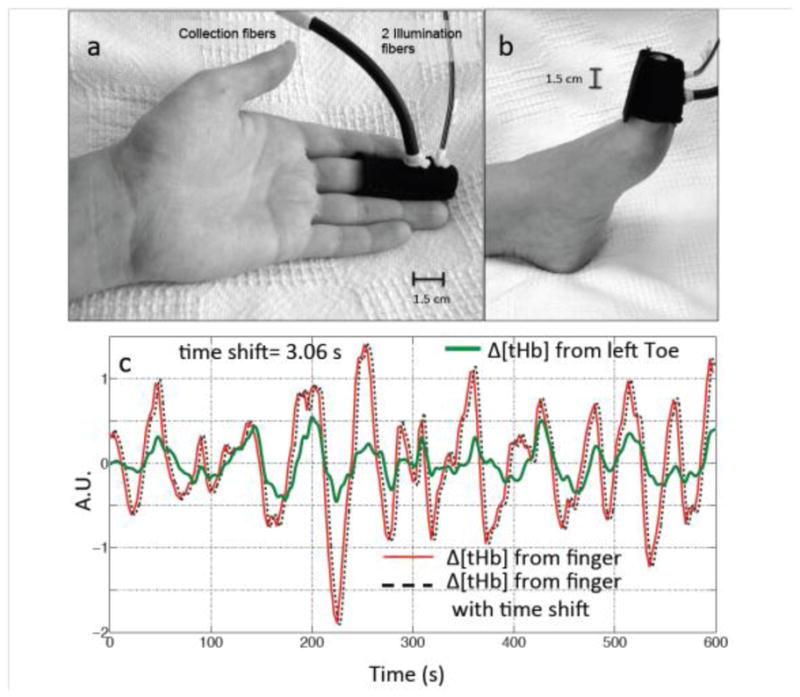
Figure 1.

Experimental setup. NIRS probes (made in-house) with one source-detector (1.5 cm separation) pair was placed on the participant’s finger (a) and toe (b). The LFO signals (Δ[tHb]) of the finger (red) and toe (green) from one participant are shown in (c), together with a temporally shifted version of the finger data (dotted black line). A.U. is arbitrary unit.
