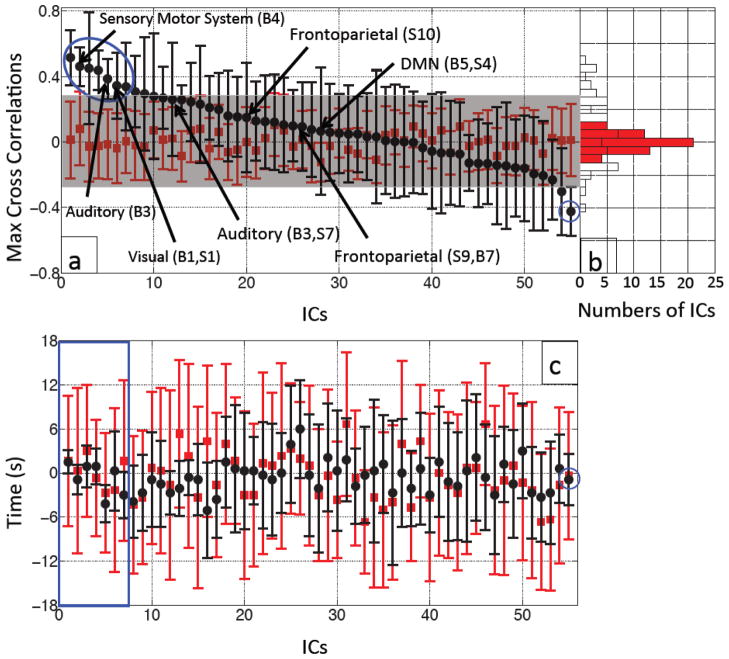
Figure 5.
Averaged MCCCs (black dots) between each participant’s IC timecourse (55 ICs) and Δ[tHb] measured at the fingertip were plotted in descending order with their error bars (a). To estimate the noise level, averaged MCCCs between the IC timecourses and temporally uncoupled Δ[tHb] (data collected 480 s later) were calculated for each IC (red squares in (a)). The blue circle marks the ICs with significant correlations with the data from the fingertip. The ICs that have high spatial correlations (R ≥ 0.5) with templates from Smith et al. (Smith et al., 2009) or Beckmann et al. (Beckmann et al., 2005) are labeled with the black arrows with their corresponding names. Figure 5(b) shows a corresponding histogram shows the distributions of the averaged MCCCs for the real (black line) and temporally uncoupled data (red blocks). Figure 5(c) shows averaged time delays (black dots) between each participant’s IC timecourse (55 ICs) and Δ[tHb] measured at the fingertip plotted with their error bars in the same order as in (a). The temporally uncoupled NIRS data was used to estimate the noise level (red squares and bars in (c)). The blue square in (c) marks the top 7 ICs with significant correlations with the data from the fingertip as shown in (a).

