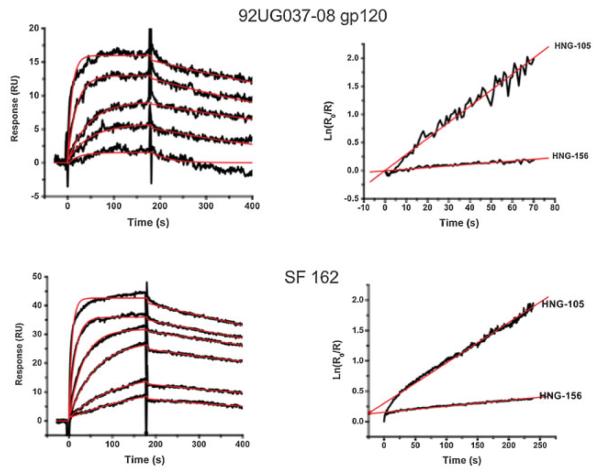
Figure 2.
Direct binding of 156 to surface-immobilized HIV-192UG037-08 gp120 (top) and HIV-1SF162 gp120 (bottom). Left: Sensorgrams depicting the interaction of 156 with gp120 at 156 concentrations of 0.125, 0.25, 0.5, 1, 2, and 4 μM. Black lines indicate experimental data, whereas red lines indicate fitting to a 1:1 Langmuir binding model with a parameter included for mass transport. Right: comparison of the linearized dissociation rates of 105 and 156.

