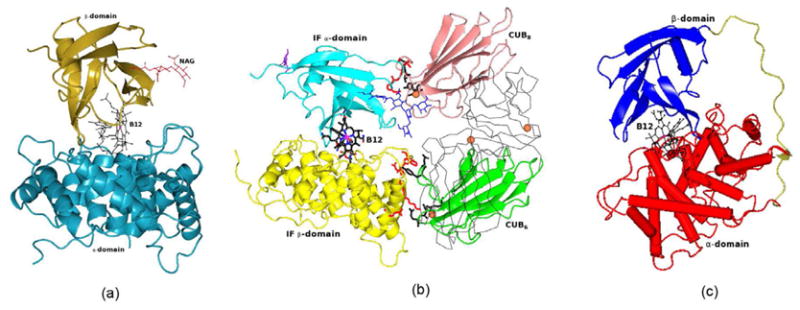
Figure 6.

(a) Worms/tubes diagram of BtuF. The B12 is shown as ball and stick in black color (b) Ribbondiagram of BtuB. The Ca2+ ions are shown as spheres in blue color. B12 is shownas ball and stick in black color.

(a) Worms/tubes diagram of BtuF. The B12 is shown as ball and stick in black color (b) Ribbondiagram of BtuB. The Ca2+ ions are shown as spheres in blue color. B12 is shownas ball and stick in black color.