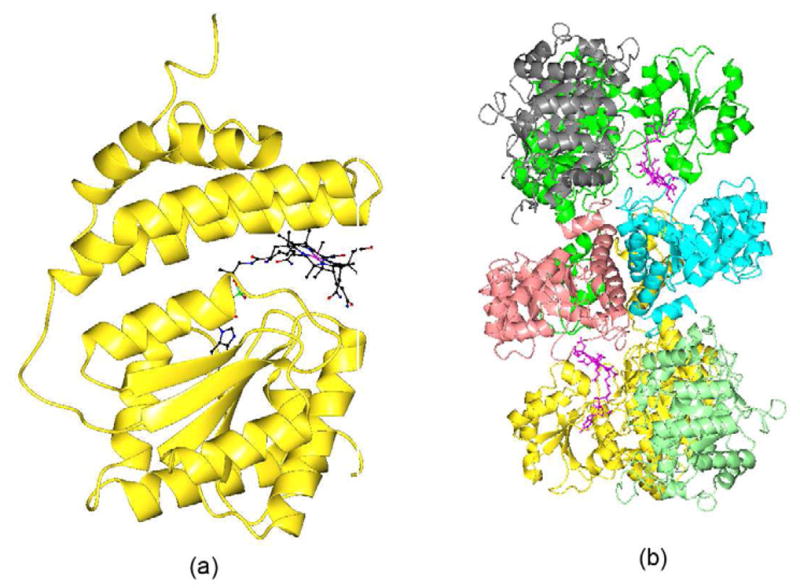
Figure 7.

(a) Ribbon diagram of Methionine Synthase. B12 is shown as ball and stick. (b) Ribbon diagram ofMethyltransferase complex. The homodimer of MeTr is shown in pink and cyan color. The small subunitof CFeSP is shown in grey and light green. The large subunit of CFeSP is shown in green and goldcolor. The B12 is shown in ball and stick and in pink color.
