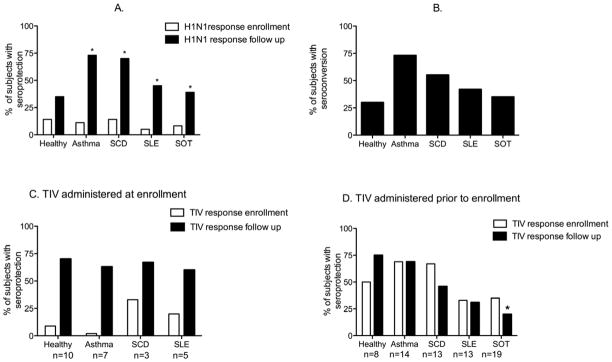
Figure 1.

A) Percentage of subjects with seroprotective titers (≥1:40) to H1N1/2009 at enrollment and follow-up; asterisk indicates a significant increase from enrollment to follow up in the percentage of subjects with seroprotective titers. B) Percentage of subjects in each cohort who seroconverted, as evidenced by a 4-fold rise in HI antibody titers to H1N1/2009 at follow-up. C) Percentage of subjects (n=25) who received TIV at enrollment and had seroprotective titers to TIV at enrollment and follow-up. D) Percentage of subjects (n=67) who had received TIV within 3 months prior to enrollment and had seroprotective titers to TIV at enrollment and follow-up. Asterisk indicates significantly lower responses for recipients of SOT relative to healthy subjects.
