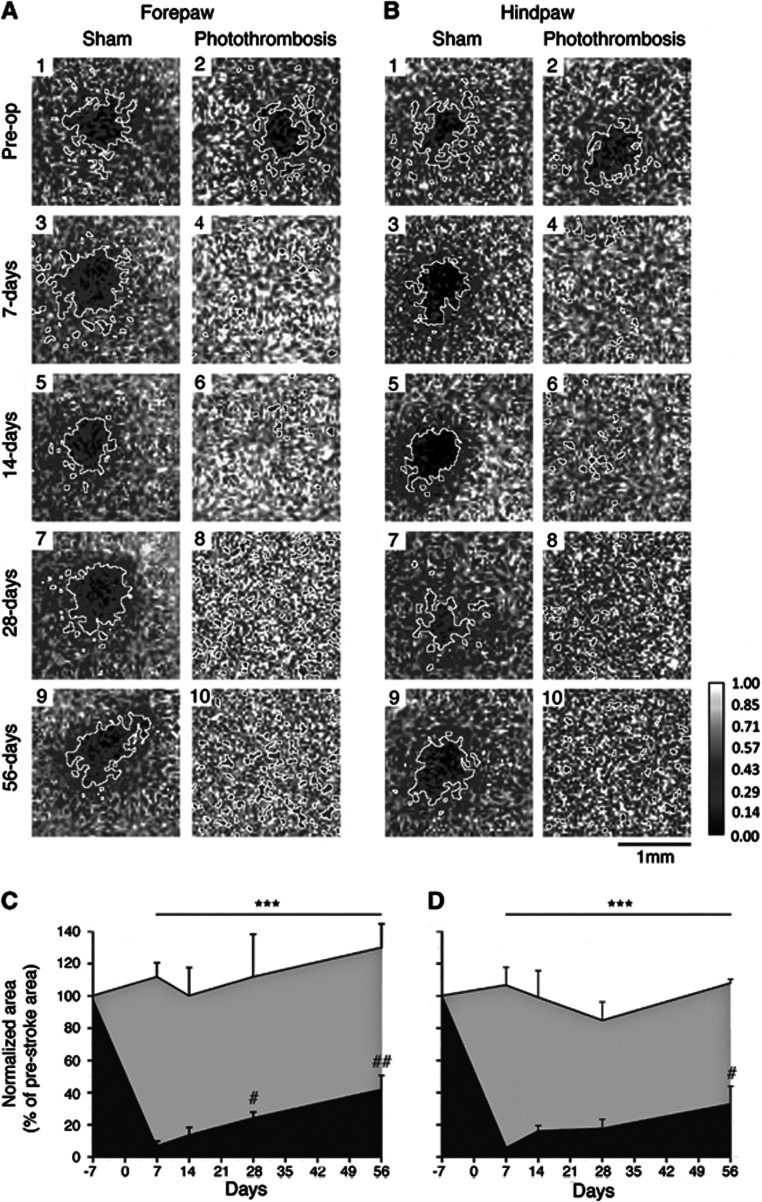
Figure 4.
Repeat optical intrinsic signaling (OIS) imaging in sham and stroke animals. Ratiometric images reveal the area of activation (enclosed by a white border) after stimulation of either right forepaw (FP) (A) or hindpaw (HP) (B). In panels A and B odd numbers are from control animals, whereas even numbers are from stroke animals: 1 and 2, prestroke; 3 and 5, 7 days after; 5 and 6, 14 days after; 7 and 8, 28 days after; and 9 and 10, 56 days afterstroke. Panels c and d show the normalized area of activation (% prestroke area) for FP and HP, respectively. Repeat imaging of the same animals over time shows a partial regain of the total area of activation for both FP and less so for HP that takes weeks to evolve. Sham animals are represented by the gray shading, whereas stroke animals are represented by the black shading. ***P<0.001 compared with both sham-operated controls and prestroke measures; #P<0.05, ##P<0.01 compared with 7 days after stroke. An n=5 per group.

