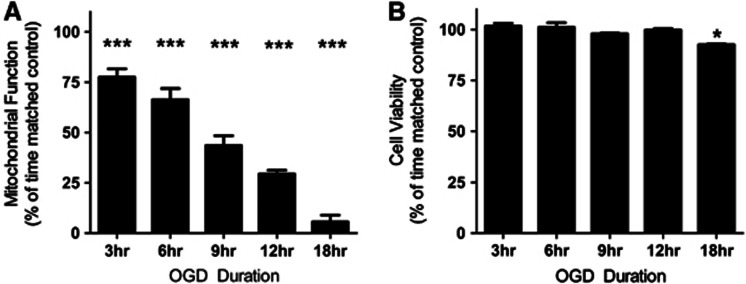
Figure 1.
Mitochondrial function decreases after oxygen glucose deprivation (OGD), whereas cell viability is largely maintained. (A) Mitochondrial function is significantly decreased at each OGD time point compared with time-matched controls. Mitochondrial function was assessed using an MTS assay, with data presented as mean±s.d., n=8 for each time point. (B) Cell viability is maintained up to 12 hours OGD, with an increase in cell death after 18 hours OGD. Cell viability was assessed using a trypan blue dye exclusion assay. Data are presented as mean±s.d., n=3 for each time point. All data are expressed as a percentage of contemporaneous time matched controls (*P<0.05, ***P<0.0001, T-test).

