Figure 2.
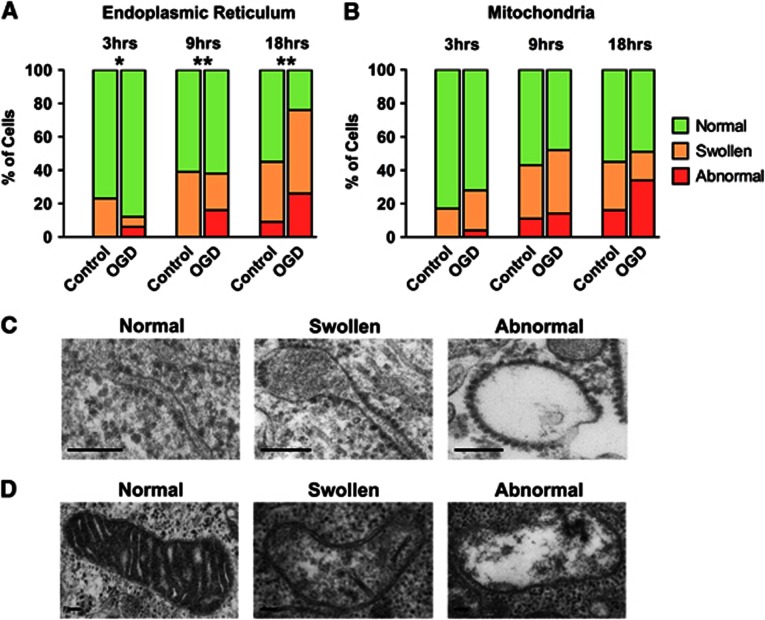
The endoplasmic reticulum (ER) and mitochondria display progressive morphologic changes after oxygen glucose deprivation (OGD). (A) OGD induced increases in the number of cells containing swollen and abnormal ER. Significant changes in the distribution of ‘normal', ‘swollen', and ‘abnormal' ER within cells were seen after 3, 9, and 18 hours OGD compared with the time-matched controls (*P<0.05, **P<0.01, χ2). (B) The occurrence of mitochondrial morphologic abnormality increases after longer OGD durations. (C) Representative electron micrographs of the three grades of ER morphology. Scale bar=0.1 μm. (D) Representative electron micrographs of the three grades of mitochondrial morphology. Scale bar=0.1 μm.

