Figure 2.
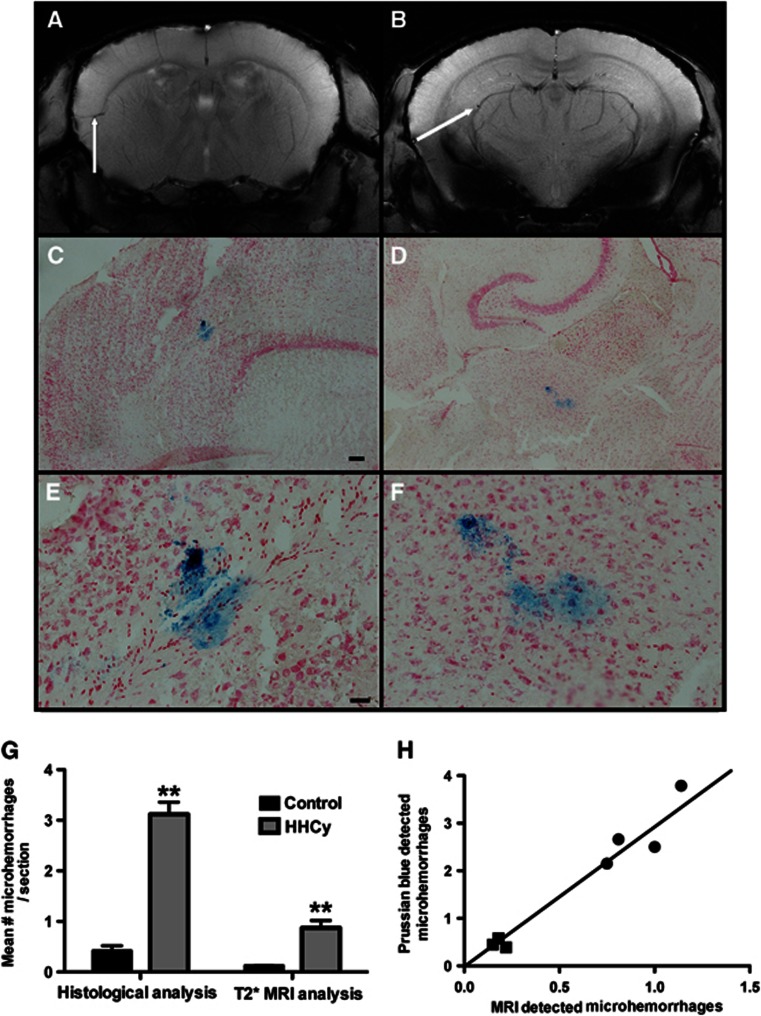
Hyperhomocysteinemia (HHCy) is associated with increased microhemorrhages. (A, B) Representative coronal T2* MRI images from HHcy mice are shown. The white arrows indicate microhemorrhages. (C–F) The Prussian blue-stained horizontal tissue sections are shown. (C) The microhemorrhage detected in (A), and (D) the microhemorrhage detected in (B) are shown. (E, F) High magnification images of (C) and (D), respectively, are shown. (C, D) Magnification= × 40, scale bar in (C) for (C) and (D)=120 μm; (E, F) magnification= × 200, scale bar in (E) for (E) and (F)=25 μm. (G) Quantification of microhemorrhages is shown. Numbers of microhemorrhages were counted and are shown as a per section count for histologic analysis (Prussian blue) in all study animals and for the T2* MRI analysis, which was performed in a subset of animals. **Indicates P<0.01 by t-test. (H) The correlation of MRI detection of microhemorrhages (x axis) and the Prussian blue detection of microhemorrhages (y axis) is shown. Square symbols represent the mice receiving control diet and round symbols represent the mice receiving hyperhomocysteinemic diet. The line shows the line of best fit. R2 for the correlation=0.95, P<0.001 by linear regression analysis. MRI, magnetic resonance imaging.

