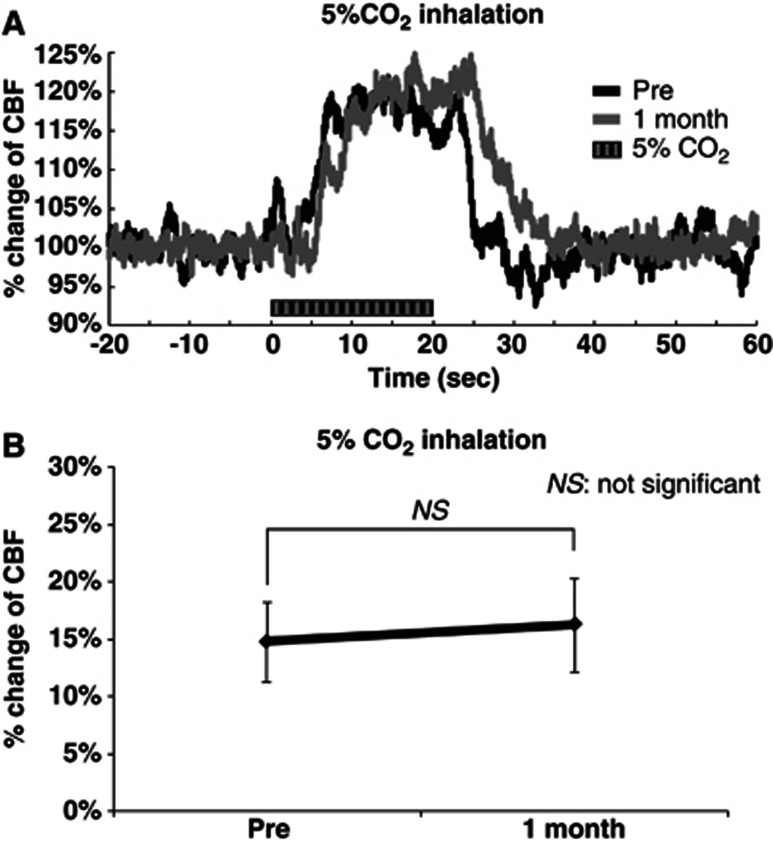
Figure 4.
Increase in cerebral blood flow (CBF) evoked by 5% CO2 inhalation. (A) Time–response curve of increase in CBF. Time–response curves were normalized to the baseline level (20 seconds before sensory stimulation) and shown for one representative animal. Horizontal bars indicate the stimulation period. (B) Mean percentage increase in CBF within 10 to 20 seconds 5% CO2 inhalation (N=5). Error bars indicate s.d.

