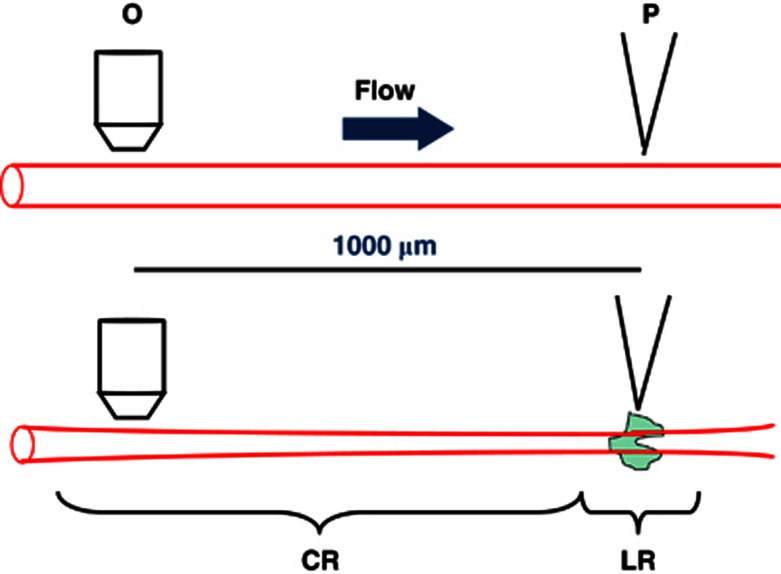
Figure 1.
Experimental approach for measurement of conducted vasomotor responses in arterioles (here depicted as local and conducted vasoconstriction). A micropipette (P) tip for delivery of agonist (green shade) is placed adjacent to an arteriole. It is important to make sure that the agonist is carried away from the vessel with the superfusate flow. At 1,000 μm in the upstream direction, the arteriole diameter is recorded through a microscope objective. The magnitude of the conducted response (CR) is seen to decay with distance from the local response (LR). See text for further details.

