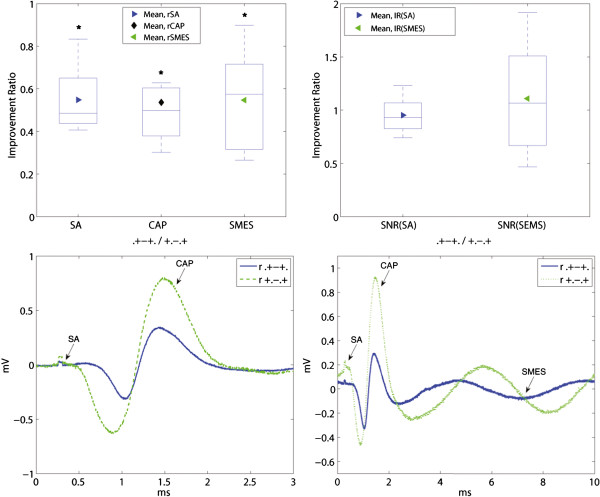
Figure 8.
Effect of moving the end tripolar contacts inwards the cuff. The rCAP and both interfering signals rSA and rSMES are shown on the upper-left inset. The resulting IRs of both SNRs are plotted in the upper-right inset. The results are presented in box plots where the central mark represents the median value; the edges of the box are the 25th and 75th percentiles; the whiskers give the range of data values; laterally pointing triangles represent average values. An asterisk is used to show the statistically significant IR (p < 0.05). The bottom illustrative recordings show the “end effect” for the 5 mm inwards contact displacement. The noise reduction was very close to that of the compound action potential (CAP) thus having a small impact in SNR. The stimulation artifacts (SAs) and CAPs appear chronologically in the lower-left inset without the induced simulated myoelectric signal (SMES). Recordings from both configurations were obtained during the same session.

