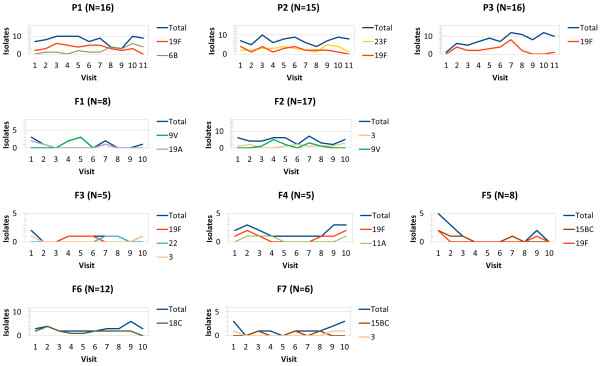
Figure 3.

Observed numbers of isolates for the most common serotypes by day-care room and visit. For each room, only serotypes responsible for more than 20% of positive samples in that room are shown. The numbers of enrolled children in each room are indicated in the parentheses.
