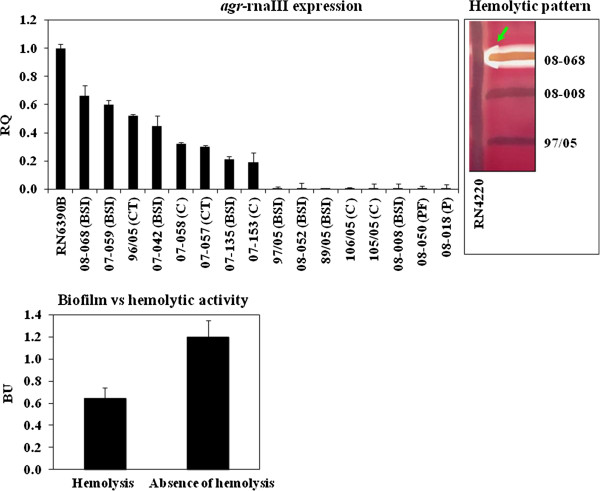
Figure 5.

agr differential expression in USA400-related isolates. Top left:rnaIII expression was analyzed by RT-qPCR using ΔΔCT comparative method. RQ: Relative quantity, (BSI): bloodstream infection, (CT): catheter tip, (P): Pneumonia, (C): colonization and (PF): prosthesis fragment. Top right: The arrow indicates the arrow-tip-like zone of the δ-hemolysin activity on sheep blood agar. Bottom: Mean biofilm values (BU) for the populations formed by isolates showing hemolytic activity or absence of hemolysis.
